
how to measure mud pump efficiency factory

Pumps tend to be one of the biggest energy consumers in industrial operations. Pump motors, specifically, require a lot of energy. For instance, a 2500 HP triplex pump used for frac jobs can consume almost 2000 kW of power, meaning a full day of fracking can cost several thousand dollars in energy costs alone!
So, naturally, operators should want to maximize energy efficiency to get the most for their money. Even a 1% improvement in efficiency can decrease annual pumping costs by tens of thousands of dollars. The payoff is worth the effort. And if you want to remotely control your pumps, you want to keep efficiency in mind.
In this post, we’ll point you in the right direction and discuss all things related to pump efficiency. We’ll conclude with several tips for how you can maintain pumping efficiency and keep your energy costs down as much as possible.
In simple terms, pump efficiency refers to the ratio of power out to power in. It’s the mechanical power input at the pump shaft, measured in horsepower (HP), compared to the hydraulic power of the liquid output, also measured in HP. For instance, if a pump requires 1000 HP to operate and produces 800 HP of hydraulic power, it would have an efficiency of 80%.
Remember: pumps have to be driven by something, i.e., an electric or diesel motor. True pump system efficiency needs to factor in the efficiency of both the motor AND the pump.
Consequently, we need to think about how electrical power (when using electric motors) or heat power (when using combustion engines) converts into liquid power to really understand pump efficiency.
Good pump efficiency depends, of course, on pump type and size. High-quality pumps that are well-maintained can achieve efficiencies of 90% or higher, while smaller pumps tend to be less efficient. In general, if you take good care of your pumps, you should be able to achieve 70-90% pump efficiency.
Motor efficiency is also an important factor here. Motor efficiency depends on the fuel type, whether electricity or hydrocarbon, which in turn depends on availability and cost.
AC motors can achieve 90%+ efficiency when converting electrical to mechanical energy. Combustion engines are much less efficient, with typical efficiency ratings coming in at ~20% for gasoline and ~40% for diesel. Your choice of engine or motor type will depend on the availability and cost of fuel or electricity in your area.
Electric motors are more efficient than combustion engines, but site location and the cost of fuel can make the choice of combustion engines more practical.
Now that we have a better understanding of the pump efficiency metric, let’s talk about how to calculate it. The mechanical power of the pump, or the input power, is a property of the pump itself and will be documented during the pump setup. The output power, or hydraulic power, is calculated as the liquid flow rate multiplied by the "total head" of the system.
Remember: we’re trying to find the ratio of power in to power out. Since rations require equal units on both sides, we"ll have to do some conversions to get our hydraulic power units in HP. You"ll see how this is done in the example below.
IMPORTANT: to calculate true head, you also need to factor in the work the pump does to move fluid from the source. For example, if the source water is below the pump, you need to account for the extra work the pump puts in to draw source water upwards.
*Note - this calculation assumes the pump inlet is not pressurized and that friction losses are minimal. If the pump experiences a non-zero suction pressure, or if there is significant friction caused by the distance or material of the pipe, these should be factored in as well.
Every foot of water creates an additional 0.434 PSI of pressure, so we"ll find the elevation head by converting the change in elevation in feet to the suction pressure created by the water.
You"ll notice that the elevation head is minimal compared to the discharge pressure, and has minimal effect on the efficiency of the pump. As the elevation change increases or the discharge pressure decreases, however, elevation change will have a greater impact on total head.
Obviously, that’s a fair amount of math to get at the pump efficiency, considering all of the units conversions that need to be done. To avoid doing these calculations manually, feel free to use our simple pump efficiency calculator.
Our calculations use static variables (pump-rated horsepower and water source elevation) and dynamic variables (discharge flow and pressure). To determine pump efficiency, we need to measure the static variables only once, unless they change.
If you want to measure the true efficiency of your pump, taking energy consumption into account, you could add an electrical meter. Your meter should consist of a current transducer and voltage monitor (if using DC) for electrical motors or a fuel gauge for combustion. This would give you a true understanding of how pump efficiency affects energy consumption, and ultimately your bank account.
Up until this point, we’ve covered the ins and outs of how to determine pump efficiency. We’re now ready for the exciting stuff - how to improve pump efficiency!
One of the easiest ways to improve pump efficiency is to actually monitor pumps for signs of efficiency loss! If you monitor flow rate and discharge (output power) along with motor current or fuel consumption, you’ll notice efficiency losses as soon as they occur. Simply having pump efficiency information on hand empowers you to take action.
Another way to increase efficiency is to keep pumps well-maintained. Efficiency losses mostly come from mechanical defects in pumps, e.g., friction, leakages, and component failures. You can mitigate these issues through regular maintenance that keeps parts in working order and reveals impending failures. Of course, if you are continuously monitoring your pumps for efficiency drops, you’ll know exactly when maintenance is due.
You can also improve pump efficiency by keeping pumps lubricated at all times. Lubrication is the enemy of friction, which is the enemy of efficiency (“the enemy of my enemy is my friend…”).
The best way to ensure lubrication is to monitor lube tanks or sumps and make sure you always have lubrication on hand. You can also monitor lubricant consumption for significant changes. If lubricant usage goes up, it could signal that friction has increased in the system.
A fourth way to enhance pump efficiency is to ensure your pumps and piping are sized properly for your infrastructure. Although we’re bringing this up last, it’s really the first step in any pumping operation. If your pumps and piping don’t match, no amount of lubricant or maintenance will help.
Pipes have physical limits to how much fluid they can move at a particular pressure. If pipes aren’t sized properly, you’ll lose efficiency because your motor will have to work harder. It’s like air conditioning - if your ductwork isn’t sized appropriately for your home, you’ll end up paying more on your energy bill.
In this post, we’ve given you the full rundown when it comes to calculating and improving pump efficiency. You can now calculate, measure, and improve pump efficiency, potentially saving your business thousands of dollars annually on energy costs.
For those just getting started with pump optimization, we offer purpose-built, prepackaged solutions that will have you monitoring pump efficiency in minutes, even in hazardous environments.
Rig pump output, normally in volume per stroke, of mud pumps on the rig is one of important figures that we really need to know because we will use pump out put figures to calculate many parameters such as bottom up strokes, wash out depth, tracking drilling fluid, etc. In this post, you will learn how to calculate pump out put for triplex pump and duplex pump in bothOilfield and Metric Unit.

This website is using a security service to protect itself from online attacks. The action you just performed triggered the security solution. There are several actions that could trigger this block including submitting a certain word or phrase, a SQL command or malformed data.
This website is using a security service to protect itself from online attacks. The action you just performed triggered the security solution. There are several actions that could trigger this block including submitting a certain word or phrase, a SQL command or malformed data.

Pumps tend to be one of the biggest energy consumers in industrial operations. Pump motors, specifically, require a lot of energy. For instance, a 2500 HP triplex pump used for frac jobs can consume almost 2000 kW of power, meaning a full day of fracking can cost several thousand dollars in energy costs alone!
So, naturally, operators should want to maximize energy efficiency to get the most for their money. Even a 1% improvement in efficiency can decrease annual pumping costs by tens of thousands of dollars. The payoff is worth the effort. And if you want to remotely control your pumps, you want to keep efficiency in mind.
In this post, we’ll point you in the right direction and discuss all things related to pump efficiency. We’ll conclude with several tips for how you can maintain pumping efficiency and keep your energy costs down as much as possible.
In simple terms, pump efficiency refers to the ratio of power out to power in. It’s the mechanical power input at the pump shaft, measured in horsepower (HP), compared to the hydraulic power of the liquid output, also measured in HP. For instance, if a pump requires 1000 HP to operate and produces 800 HP of hydraulic power, it would have an efficiency of 80%.
Remember: pumps have to be driven by something, i.e., an electric or diesel motor. True pump system efficiency needs to factor in the efficiency of both the motor AND the pump.
Consequently, we need to think about how electrical power (when using electric motors) or heat power (when using combustion engines) converts into liquid power to really understand pump efficiency.
Good pump efficiency depends, of course, on pump type and size. High-quality pumps that are well-maintained can achieve efficiencies of 90% or higher, while smaller pumps tend to be less efficient. In general, if you take good care of your pumps, you should be able to achieve 70-90% pump efficiency.
Motor efficiency is also an important factor here. Motor efficiency depends on the fuel type, whether electricity or hydrocarbon, which in turn depends on availability and cost.
AC motors can achieve 90%+ efficiency when converting electrical to mechanical energy. Combustion engines are much less efficient, with typical efficiency ratings coming in at ~20% for gasoline and ~40% for diesel. Your choice of engine or motor type will depend on the availability and cost of fuel or electricity in your area.
Electric motors are more efficient than combustion engines, but site location and the cost of fuel can make the choice of combustion engines more practical.
Now that we have a better understanding of the pump efficiency metric, let’s talk about how to calculate it. The mechanical power of the pump, or the input power, is a property of the pump itself and will be documented during the pump setup. The output power, or hydraulic power, is calculated as the liquid flow rate multiplied by the "total head" of the system.
Remember: we’re trying to find the ratio of power in to power out. Since rations require equal units on both sides, we"ll have to do some conversions to get our hydraulic power units in HP. You"ll see how this is done in the example below.
IMPORTANT: to calculate true head, you also need to factor in the work the pump does to move fluid from the source. For example, if the source water is below the pump, you need to account for the extra work the pump puts in to draw source water upwards.
*Note - this calculation assumes the pump inlet is not pressurized and that friction losses are minimal. If the pump experiences a non-zero suction pressure, or if there is significant friction caused by the distance or material of the pipe, these should be factored in as well.
Every foot of water creates an additional 0.434 PSI of pressure, so we"ll find the elevation head by converting the change in elevation in feet to the suction pressure created by the water.
You"ll notice that the elevation head is minimal compared to the discharge pressure, and has minimal effect on the efficiency of the pump. As the elevation change increases or the discharge pressure decreases, however, elevation change will have a greater impact on total head.
Obviously, that’s a fair amount of math to get at the pump efficiency, considering all of the units conversions that need to be done. To avoid doing these calculations manually, feel free to use our simple pump efficiency calculator.
Our calculations use static variables (pump-rated horsepower and water source elevation) and dynamic variables (discharge flow and pressure). To determine pump efficiency, we need to measure the static variables only once, unless they change.
If you want to measure the true efficiency of your pump, taking energy consumption into account, you could add an electrical meter. Your meter should consist of a current transducer and voltage monitor (if using DC) for electrical motors or a fuel gauge for combustion. This would give you a true understanding of how pump efficiency affects energy consumption, and ultimately your bank account.
Up until this point, we’ve covered the ins and outs of how to determine pump efficiency. We’re now ready for the exciting stuff - how to improve pump efficiency!
One of the easiest ways to improve pump efficiency is to actually monitor pumps for signs of efficiency loss! If you monitor flow rate and discharge (output power) along with motor current or fuel consumption, you’ll notice efficiency losses as soon as they occur. Simply having pump efficiency information on hand empowers you to take action.
Another way to increase efficiency is to keep pumps well-maintained. Efficiency losses mostly come from mechanical defects in pumps, e.g., friction, leakages, and component failures. You can mitigate these issues through regular maintenance that keeps parts in working order and reveals impending failures. Of course, if you are continuously monitoring your pumps for efficiency drops, you’ll know exactly when maintenance is due.
You can also improve pump efficiency by keeping pumps lubricated at all times. Lubrication is the enemy of friction, which is the enemy of efficiency (“the enemy of my enemy is my friend…”).
The best way to ensure lubrication is to monitor lube tanks or sumps and make sure you always have lubrication on hand. You can also monitor lubricant consumption for significant changes. If lubricant usage goes up, it could signal that friction has increased in the system.
A fourth way to enhance pump efficiency is to ensure your pumps and piping are sized properly for your infrastructure. Although we’re bringing this up last, it’s really the first step in any pumping operation. If your pumps and piping don’t match, no amount of lubricant or maintenance will help.
Pipes have physical limits to how much fluid they can move at a particular pressure. If pipes aren’t sized properly, you’ll lose efficiency because your motor will have to work harder. It’s like air conditioning - if your ductwork isn’t sized appropriately for your home, you’ll end up paying more on your energy bill.
In this post, we’ve given you the full rundown when it comes to calculating and improving pump efficiency. You can now calculate, measure, and improve pump efficiency, potentially saving your business thousands of dollars annually on energy costs.
For those just getting started with pump optimization, we offer purpose-built, prepackaged solutions that will have you monitoring pump efficiency in minutes, even in hazardous environments.

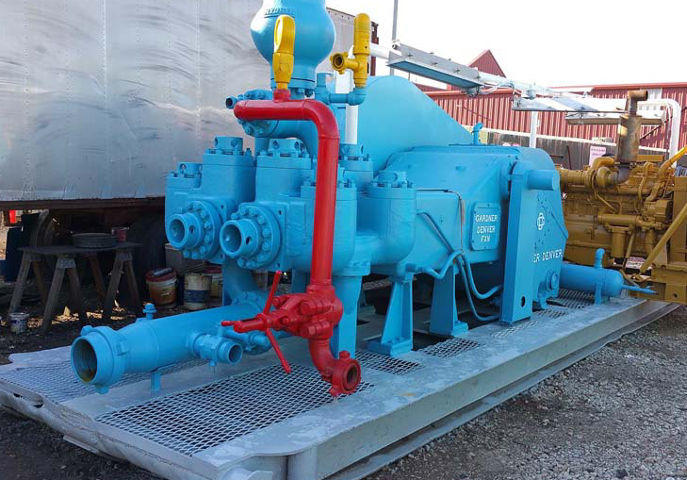
Manufactured to withstand the toughest drilling and environmental conditions, our K-Series triplex mud pumps are ideal for all drilling applications. This legacy product features a balanced forged-steel crankshaft and Southwest Oilfield Products ‘L” Shaped modules which is essential to minimize wear, noise, and operating vibrations. These attributes are essential when drilling deeper high pressure formations, long laterals and when handling corrosive or abrasive fluids and slurries.
Every American Block triplex mud pump is manufactured and fully load tested before leaving our manufacturing campus, and is available in sizes ranging from 800 HP to 2200 HP. The American Block K1600 HP Mud Pump is also available in a 2000 HP up-grade version, when more HP is needed in the same 1600 HP footprint.

In this article discussed about pump basic formulas with examples likepump power calculation formula, specific speed of centrifugal pump and affinity laws for centrifugal and displacement pumps. Also provided online calculator for pump power calculation
The work performed by the pump is equal to the weight of liquid pumped in Unit time multiplied by total Head in meters. However the pump capacity in M3/hr and liquid specific gravity are used rather than weight of liquid pumped for work done by the pump.
The input power “P” of a pump is the mechanical power inkW or Watt taken by the shaft or coupling. So the input power of the pump also called Break Horse Power (BHP).
Pump output power is called as Water Horse Power (WHP ) or Hydraulic power and it is useful work delivered by the pump. and is usually expressed by the formula
The specific speed “Nq” is a parameter derived from a dimensional analysis which allows a comparison of impellers of various pump sizes even when their operating similar Q -H range. The specific speed can be used to classify the optimum impeller design.
Specific Speed of pump (Nq) is defined as the speed in RPM at which a geometrically similar impeller would run if it were reduced proportionately in size so as to delivered 75 kg of water per second to the height of 1 m.
Nq is also defined as the theoretical rotational speed at which a geometrically similar impeller would run if it were of such a size as to produce 1 m of head at a flow rate of1 m3/sec at the best efficiency point.
Pump Efficiency is the most important factor while calculating power consumption. So while selection of the higher rating of pump always choose best efficiency pump set.

In this article provided pump related formulas like fluid flow rate and velocity, power calculation, Specific Speed of Pump (Nq), Total Head, Pump Torque and temperature rise, Net Positive Suction Head, Affinity laws for pump, Pump Efficiency & Overall Efficiency of the Pump
Specific Speed of pump (Nq) is identifies the geometrical similarity of pumps. It is useful to comparing different pump designs irrespective of pump size
In vertical pipe any liquid coloumn of water exerts a certain pressure (force per unit area) on a horizontal surface at the bottom area, this pressure is expressed in metres of liquid column or kg/cm2.
Pressure head calculated as per pumping system source tank is under some gauge pressure or vacuum open or open toatmosphericthan pressure head is calculated in metres of water column (MWC) of Feet of water column of liquid.
The amount of NPSH the pump requires to avoid cavitation is called Net Positive Suction Head Required (NPSHr). This value of the pump is determined based on actual pump test by the vendor.
Net positive suction head available must be greater than or equal to the net positive suction head requiredto avoid cavitation. Itcan bestated mathematically as shown below.NPSH a ≥ NPSH

The piston is one of the parts that most easily become worn out and experience failure in mud pumps for well drilling. By imitating the body surface morphology of the dung beetle, this paper proposed a new type (BW-160) of mud pump piston that had a dimpled shape in the regular layout on the piston leather cup surface and carried out a performance test on the self-built test rig. Firstly, the influence of different dimple diameters on the service life of the piston was analyzed. Secondly, the analysis of the influence of the dimple central included angle on the service life of the piston under the same dimple area density was obtained. Thirdly, the wear of the new type of piston under the same wear time was analyzed. The experimental results indicated that the service life of the piston with dimples on the surface was longer than that of L-Standard pistons, and the maximum increase in the value of service life was 92.06%. Finally, the Workbench module of the software ANSYS was used to discuss the wear-resisting mechanism of the new type of piston.
The mud pump is the “heart” of the drilling system [1]. It has been found that about 80% of mud pump failures are caused by piston wear. Wear is the primary cause of mud pump piston failure, and improving the wear-resisting performance of the piston-cylinder friction pair has become the key factor to improve the service life of piston.
Most of the researchers mainly improve the service life of piston through structural design, shape selection, and material usage [1, 2]. However, the structure of mud pump piston has been essentially fixed. The service life of piston is improved by increasing piston parts and changing the structures of the pistons. However, the methods have many disadvantages, for example, complicating the entire structure, making piston installation and change difficult, increasing production and processing costs, and so on. All piston leather cup lips use rubber materials, and the material of the root part of the piston leather cup is nylon or fabric; many factors restrict piston service life by changing piston materials [3]. Improving the component wear resistance through surface texturing has been extensively applied in engineering. Under multiple lubricating conditions, Etsion has studied the wear performance of the laser surface texturing of end face seal and reciprocating automotive components [4–6]. Ren et al. have researched the surface functional structure from the biomimetic perspective for many years and pointed out that a nonsmooth surface structure could improve the wear resistance property of a friction pair [7, 8]. Our group has investigated the service life and wear resistance of the striped mud pump piston, and the optimal structure parameters of the bionic strip piston have improved piston service life by 81.5% [9]. Wu et al. have exploited an internal combustion engine piston skirt with a dimpled surface, and the bionic piston has showed a 90% decrease in the average wear mass loss in contrast with the standard piston [10]. Gao et al. have developed bionic drills using bionic nonsmooth theory. Compared with the ordinary drills, the bionic drills have showed a 44% increase in drilling rate and a 74% improvement in service life [11]. The present researches indicate that microstructures, like superficial dimples and stripes, contribute to constituting dynamic pressure to improve the surface load-carrying capacity and the wear resistance of the friction pair [12–21].
In nature, insects have developed the excellent wear-resistant property in the span of billions of years. For instance, the partial body surface of the dung beetle shows an irregularly dimpled textured surface with the excellent wear-resistant property that is conducive to its living environment [7, 8, 22]. The dung beetle, which is constantly active in the soil, shows a body surface dimple structure that offers superior drag reduction. These dimples effectively reduce the contact area between the body surface and the soil. Moreover, the friction force is reduced. Therefore, the dung beetle with the nonsmooth structure provides the inspiration to design the bionic mud pump piston. This paper proposed a new type of piston with dimpled morphology on its surface and conducted a comparative and experimental study of different surface dimpled shapes, thus opening up a new potential to improve the service life of the mud pump piston.
A closed-loop circulatory system was used in the test rig, which was built according to the national standard with specific test requirements. The test rig consisted of triplex single-acting mud pump, mud tank, in-and-out pipeline, reducer valve, flow meter, pressure gauge, and its principle, as shown in Figure 1. Both the pressure and working stroke of the BW-160 mud pump are smaller than those of the large-scale mud pump, but their operating principles, structures, and working processes are identical. Therefore, the test selected a relatively small BW-160 triplex single-acting mud pump piston as a research object, and the test results and conclusion were applicable to large-scale mud pump pistons. The cylinder diameter, working stroke, reciprocating motion velocity of piston, maximum flow quantity, and working pressure of the BW-160 triplex single-acting mud pump were 70 mm, 70 mm, 130 times/min, 160 L/min, and 0.8–1.2 MPa, respectively.
The mud pump used in the test consisted of water, bentonite (meeting the API standard), and quartz sand with a diameter of 0.3–0.5 mm according to actual working conditions. The specific gravity of the prepared mud was 1.306, and its sediment concentration was 2.13%. Whether mud leakage existed at the venthole in the tail of the cylinder liner of the mud pump was taken as the standard of piston failure. Observation was made every other half an hour during the test process. It was judged that the piston in the cylinder failed when mud leaked continuously; its service life was recorded, and then it was replaced with the new test piston and cylinder liner. The BW-160 mud pump is a triplex single-acting mud pump. The wear test of three pistons could be simultaneously conducted.
The mud pump piston used in the test consisted of a steel core, leather cup, pressing plate, and clamp spring. The leather cup consisted of the lip part of polyurethane rubber and the root part of nylon; the outer diameter on the front end of the piston was 73 mm, and the outer diameter of the piston tail was 70 mm, as shown in Figure 2. We proceeded in two parts during the design of the dimpled layout pattern because the piston leather cup consisted of two parts whose materials were different. The dimples at the lip part of the leather cup adopted an isosceles triangle layout pattern, and the dimples at the root part were arranged at the central part of its axial length, as shown in Figure 3(a). Dimple diameter (D, D′), distance (L), depth (h), and central included angle (α) are shown in Figure 3. The dimples on the piston surface were processed by the CNC machining center. Since then, the residual debris inside the dimples was cleaned.
Schematic of dimpled piston: (a) dimpled layout of piston, (b) dimpled array form diagram, (c) cross section view of the piston leather cup, and (d) original picture of dimpled piston.
The test program was divided into three contrast groups. The dimple depth in the test was 2.5 mm. Table 1 shows the comparison between the service life of dimpled piston with different diameters L-D1, L-D2, and L-D3 and that of the L-Standard piston. In Table 1, a comparison between the L-D4 piston with dimples at the leather cup root and the L-D2 piston is shown to study the influence of dimples at the leather cup root on the piston service life. Table 2 gives the influence of the dimple central included angle on piston service life when the dimple area density was the same by taking the L-D2 area density as a criterion. Table 3 displays a comparison of the wear patterns of pistons with different dimple diameters and L-Standard pistons under the same wear time. This object of the group test is to analyze the dimple wear pattern at the leather cup root under the existence of dimples at the roots of all leather cups.
Table 1 shows that average service lives of L-Standard, L-D1, L-D2, and L-D3 were 54.67 h, 57.17 h, 76.83 h, and 87.83 h, respectively. Therefore, the mud pump pistons with dimples provide longer service life than the L-Standard piston. As the dimple diameter increases, the piston service life was improved, and the largest percentage increase of the service life was 60.65%. The service life of the L-D4 piston was about 81.17 h, which increased by 7.94% compared with that of the L-D2 piston, indicating that the piston with dimples at the leather cup root could improve piston service life.
Figure 4 illustrates the surface wear patterns of pistons with different dimple diameters in the service life test. Figures 4(a) and 4(a′) show wear patterns on the surface of the L-Standard piston. This figure shows that intensive scratches existed in parallel arrangement on the piston leather cup surface, enabling high-pressure mud to move along the scratches from one end of the piston to the other easily, which accelerated the abrasive wear failure with the abrasive particles of the piston. Figures 4(b), 4(b′), 4(c), 4(c′), 4(d), and 4(d′) show the wear patterns of the leather cup surfaces of L-D1, L-D2, and L-D3 pistons, respectively. Figures 4(b), 4(b′), 4(c), 4(c′), 4(d), and 4(d′) show that the scratches on the leather cup surface became shallower and sparser and the surface wear patterns improved more obviously as the dimple diameter increased. If the piston leather cup surface strength was not affected to an extent as the dimple diameter increased, the reduced wear zone near the dimple would become greater and greater, indicating that the existence of dimples changed the lubricating status of the leather cup surface, their influence on nearby dimpled parts was more obvious, and they played active roles in improving the service life of the piston.
Surface wear patterns of pistons with different dimple diameters in the service life test: (a) L-Standard piston, (b) L-D1 piston, (c) L-D2 piston, and (d) L-D3 piston. (a′, b′, c′, d′) are partial enlarged pictures of (a, b, c, d).
Figure 5 displays the wear patterns of the leather cup root parts of the L-D4 and L-D2 test pistons. The wear patterns of the nylon root parts of the L-D4 pistons are fewer than those of the L-D2 pistons, as shown in Figure 5. When the leather cup squeezed out high-pressure mud as driven by the piston steel core, it experienced radial squeezing while experiencing axial wear. Therefore, the area with the most serious wear was the piston leather cup root part, and the friction force at the leather cup root was much greater than that at the other areas. The rapid wear at the root decreased the piston load-carrying capacity and then affected the service life of piston. The dimples at the piston leather cup root could reduce the wear of the piston leather cup root and improve the service life of piston.
Wear patterns of the piston leather cup root with and without dimples: (a) comparison chart of root wear of the L-D4 and L-D2 pistons, (b) partial enlarged diagram of root wear of the L-D4 piston, and (c) partial enlarged diagram of root wear of the L-D2 piston.
Table 2 indicates that the average service life of the L-S1 piston was 105.00 h, which is about twice that of the L-S2 piston (59.50 h) and was obviously improved in comparison with that of the L-D2 piston (76.83 h), indicating that, under the same dimple area density, the smaller the dimple central included angle was, that is, the closer the circumferential arrangement of dimples was, the longer the service life of the piston would be, and the increase of the maximum value of service life was 92.06%.
Figure 6 shows the surface wear patterns of the L-S1 and L-S2 test pistons. In Figures 6(a) and 6(a′), the scratches on the piston leather cup surface became sparse and shallow in the dimpled area. Figures 6(b) and 6(b′) show that the wear was slight in the area close to the dimples. The farther the scratches were from the dimpled area, the denser and deeper the scratches would be. The L-S1 piston had a small dimple central included angle, which was arranged more closely on the piston surface. The lubricating effects of oil storage in each row of dimples were overlaid very well, which was equivalent to amplifying the effect of each row of dimples in Figure 6(b), making the wear on the whole piston leather cup surface slight, preventing the entry of high-pressure mud into the frictional interface, and lengthening the service life of piston.
Wear patterns of pistons with different dimple central included angles under the same area density: (a) L-S1 piston and (b) L-S2 piston. (a′, b′) were partial enlarged pictures of (a, b).
Before all pistons have not failure, T1, T2, T3, and L-Standard experienced equal-time wear. This test set the wear time at 30 h. The piston leather cup mass was W0 before the test. After the test, the mass of the piston leather cup was W1. During the test, the wear loss of the piston leather cup was W = W0 − W1. The wear mass percentage of the test piston leather cup was calculated as φ = W/W0. The test results are shown in Table 3.
Table 3 shows that the average wear mass percentages of the L-Standard, T1, T2, and T3 pistons were 6.98%, 6.59%, 4.22%, and 3.83%, respectively. The wear mass percentages of the dimpled pistons were basically lower than those of the L-Standard piston and decreased as the dimple diameter increased. Figure 7 shows the wear patterns of the piston leather cup. The wear rules displayed in Figure 7 were similar to those displayed in Figure 4. The only difference was that the wear in Figure 7 was slighter than that in Figure 4. Based on the wear under the same time, the existence of dimples reduced the piston wear.
During the operation of the mud pump piston, the outside surface of the piston leather cup comes in contact with the inner wall of the cylinder liner and simultaneously moves to push the mud. The lip part of the piston leather cup mainly participated in the piston wear and exerted a sealing effect, while the piston root part mainly exerted centralizing and transitional effects. In the mud discharge stroke, the lip part of the piston experienced a “centripetal effect,” and a gap was generated between the lip part and the cylinder liner. The greater the contact pressure between the lip part and cylinder liner of the piston was, the smaller the gap was, and the entry of high-pressure mud into the contact surface between the piston and cylinder liner was more difficult. The piston root easily experienced squeezing under high pressure, and the smaller the equivalent stress caused by the piston root was, the more difficult the squeezing to occur. Hence, the contact pressure at the lip part of the piston and the equivalent stress at the root were analyzed, and they would provide a theoretical basis for the piston wear-resisting mechanism. The ANSYS Workbench module was used to perform a comparative analysis between the contact pressure at the lip part and the equivalent stress at the root of the three kinds of pistons (i.e., L-Standard piston, L-S1 piston, and L-D1 piston). The service life of the L-S1 piston exhibited the best improvement effect, whereas that of the L-D1 piston demonstrated the worst improvement effect. The piston adopted a 1 mm hexahedral grid, and the grid nodes and elements are as shown in Table 4.
We could obtain the contact pressure nephograms of the three pistons by analyzing the contact pressure of the lip parts of the L-Standard piston and two dimpled pistons, as shown in Figure 8.
The contact pressure nephograms of the three pistons indicate that the dimpled structure on the piston surface changed the distribution state of contact pressure. Three nodes were selected at the same position of each piston to obtain the contact pressure values. The node positions are shown in Figure 8(c), and the average pressure value of three nodes was the pressure value at the lip part of this piston. The contact pressure value of the L-Standard piston was 0.6027 MPa and that of the L-D1 and L-S1 pistons was 0.6840 MPa and 1.0994 MPa, respectively. Compared with the L-Standard piston, the contact pressure at the lip part of the L-S1 piston increased, the gap between the piston and cylinder liner became small, which could effectively prevent abrasive particles from participating in the wear and resulting in piston failure, and there was greater improvement in the service life of piston. The contact pressure of the L-D1 piston did not increase too much, and the degree of improvement of the piston service life was not obvious.
An equivalent stress analysis of the root parts of the L-Standard piston and two dimpled pistons was conducted to obtain the equivalent stress nephograms of the three pistons, as shown in Figure 9.
The equivalent stress nephograms of the three pistons show that the root of the L-Standard piston bore great stress and was easily squeezed, which accelerated piston wear and reduced piston service life. The dimpled structure could reduce the equivalent stress at the piston root and lengthen piston service life. Three nodes were selected in the same root positions of the three pistons. Their positions are as shown in Figure 9(c). The average value of the equivalent stresses of the three nodes was the equivalent stress value at the root of this piston. The equivalent stress value of the L-Standard piston was 0.1093 MPa, that of the L-D1 piston was 0.1066 MPa, and that of the L-S1 piston was 0.0922 MPa. The dimpled structure of the L-S1 piston could reduce the equivalent stress at the root and reduce the occurrence of root squeezing wear. The equivalent stress value of L-D1 did not decrease too much, and the degree of improvement of the piston service life was not obvious.
The lubricating oil on the mud pump piston surface could reduce the wear of piston and cylinder liner and improve the service life of pistons with the reciprocating movement. The lubricating oil would eventually run off and lose lubricating effect, which would result in piston wear. The finite element fluid dynamics software CFX was used to establish the fluid domain model of the dimpled and L-Standard pistons and analyze the lubricating state on the piston surface. The piston surface streamlines are shown in Figure 10. This figure shows that the lubricating fluid did not experience truncation or backflow phenomenon when passing the surface of the L-Standard piston. When the lubricating fluid flowed through the surface of the dimpled piston, it presented a noncontinuous process. Its flow velocity at the dimpled structure slowed down obviously because it was blocked by the dimpled structure.
Figure 11 shows the piston cross section streamline. This figure shows that the existence of dimples changed the distribution status of the lubricating flow fields on the contact surface between the piston and cylinder liner. The lubricating oil entered the dimpled structure in a large quantity, and the flow velocity slowed down. The dimpled structure on the piston surface enlarged the storage space of the lubricating oil and made it difficult for the lubricating oil inside the dimpled structure to be taken away by the cylinder liner to improve the lubricating conditions of the friction pair interface, reduce the frictional resistance between the piston and cylinder liner, reduce wear, and improve the piston service life.
When the piston moved in the cylinder liner, a small quantity of solid particles in mud entered gap of piston and cylinder liner and participated in abrasion. The dimpled structure on the piston surface could store some abrasive particles (as shown in Figure 6(a′)) during the piston wear process to prevent these particles from scratching the piston and cylinder liner and generating gullies, thus avoiding secondary damage to the piston and cylinder liner and improving the piston service life.
This paper presented a dimpled-shape mud pump piston; that is, the piston leather cup surface had a dimpled array morphology in regular arrangement. The experimental results can provide the basic data for design engineering of the mud pump piston with a long service life. The comparative analyses of service life and wear patterns for dimpled mud pump pistons and L-Standard pistons were conducted. The main results and conclusions were summarized as follows:(1)The service life of the mud pump piston with dimpled morphology on the surface improved in comparison with that of the L-Standard piston, and the service life increase percentages were from 4.57% to 92.06%.(2)The piston service life would increase with the dimple diameter under the same dimpled arrangement pattern, and the maximum increase in the value of service life was 60.65%.(3)The service life of the piston with dimples increased by 7.94% in comparison with that with none.(4)Under the same dimpled arrangement patterns and area densities, the tighter and closer the dimples were arranged on the piston surface, the longer the service life of piston was, and the maximum increase in the value of service life was 92.06%.(5)Under the same wear time, the wear of the dimpled piston slightly decreased in comparison with that of the L-Standard piston, and the minimum value of wear mass percentage was 3.83%.(6)The dimpled shape could not only change the stress state of the piston structure, improve piston wear resistance, and reduce root squeezing, but also increase oil storage space, improve lubricating conditions, and enable the accommodation of some abrasive particles. Furthermore, the dimpled shape was the key factor for the service life improvement of the mud pump piston.
Whether onshore or offshore, well-drilling sites rely on a multitude of systems to successfully perform the drilling operation. The mud pump is a key component tasked with circulating drilling fluid under high pressure downhole. The mud pump can be divided into two key sections: the power end and the fluid end. The alignment of the power end to fluid end on mud pumps is key to achieving suitable life and performance of the piston and liner system.
Misalignment contributes to accelerated wear on both the piston and the liner, and replacing these components requires downtime of the pump. The traditional method of inspecting alignment is to remove the piston from the piston rod, stroke the pump forward and check the vertical and horizontal alignment of the piston rod OD to the piston liner ID with micrometers. This is a time consuming and cumbersome technique that was ultimately not well suited to troubleshoot and solve alignment issues.
“I’m a firm believer in Pinpoint’s Mud Pump Alignment Kit, having used it as well as the old manual methods and even Faro arms in troubleshooting pumps on offshore rigs. In the hands of someone who understands pump alignment it is a powerful yet portable tool.”
“We routinely utilize Pinpoint Laser Systems’ Mud Pump Alignment Kit. We have one service technician dedicated to pump alignments and have seen continued success correcting issues on pumps after numerous rebuild attempts by others proved unsuccessful.”
Engineered to help you go anywhere in the factory or on the grounds to do the job with ease, all Pinpoint alignment and measurement solutions are designed to keep comfort, grip, and portability in mind.
Pinpoint products are not only easy to use but are easy to customize and even easier to upgrade down the road. The Microgage laser alignment system is the last measurement tool you will ever need.
USA built to handle most of your alignment tasks, Pinpoint manufactures products capable of capturing precise measurement data that exceed expectations. A flexible tool when you’re pressed for time.

Savvy energy staffers know that monitoring and tracking the performance of their pumping systems canbe a very profitable undertaking. Just how profitable, though, oftenhinges on which key performance indicators are followed over time.A noted expert suggests a combined approach.
MTwas proud to publish this article by one of the most recognized and respected technical experts in the pump world as part of our very first Utilities Manager supplement in February 2006. Almost seven years later, its recommendations are as relevant as ever for reliability- and efficiency-focused users of pumping systems.
Pump systems in industry often are connected to various types of monitoring and control systems. Typically, end users will only monitor one or several parameters, such as flow rate, pressure, power and/or current. That rather limited type of monitoring, though, really doesn’t provide a full view of a pump’s performance. By just monitoring a few individual parameters, a company risks overlooking important information about system performance as a whole.
It is difficult to find useful key performance indicators (KPIs) to track in the quest for improved efficiencies in a pumping system. Tracking maintenance costs by themselves certainly can provide good data on the health of a system. But, in many cases, better information can be obtained by combining several parameters into a one KPI and following it over time. One way to do this is to relate flow and power, rather than to simply measure them independently. Let’s examine how this can be done.
Fluid system relationshipsFor pump systems, the relationship between fluid power, flow rate, pressure (head) and specific gravity of the fluid can be expressed in the following equations:
In order to determine the electrical power used by the system it is necessary to divide the fluid power by the efficiencies of the different components that produce it: i.e. motor, drive and pump efficiencies.
Specific energy (Es) is good measure to use for calculating the cost of pumping. This is the energy used to move a certain volume through the system. It is measured as Watt hours/gallon, or any other suitable units, and it has the advantage of being a direct measurement of the cost of pumping once you know the cost of energy. (This is the same as measuring the miles per gallon for a car.)
Specific energy is a useful measure for comparing different system solutions and the cost of pumping. In systems where the flow is constant, this is a simple task by using the equations above. In systems with varying flow rates, it becomes a little more complicated.
First, Es needs to be calculated as a function of flow rate, which requires information from pump, motor and drive manufacturers. The pump manufacturer has to provide pump curves for variable speed operation, while the motor and drive suppliers have to provide efficiency curves as a function of load and speed.
Specific energy (Es) is a linear function of the head if the other factors are constant. We can, therefore, plot it as a function of head for different overall efficiencies. See Fig. 1 where the overall efficiency is the product of the different component efficiencies from Equation 5.
The lowest line in the diagram represents 100% efficiency, which, of course, is not reachable. If input power, flow rate and head are available at a specific duty point, it is relatively easy to mark the value of Es as a point in Fig. 1, and then interpolate the overall efficiency.
Using a program such as the U.S. Department of Energy’s (DOE’s) Pump System Assessment Tool (PSAT), the best available pump and motor efficiencies for a specific duty point can be found and a lowest possible specific energy can be calculated for the duty point in question, if there is no VSD involved. It is harder to find out what the efficiency of a motor/drive combination is, as it varies depending on how well these two components fit together. The drive, if present, introduces additional losses in the motor that should be accounted for.
(Fig. 2 gives an idea about the combined efficiency of a drive and motor. Motors react differently to different drives. It is, therefore, a good idea to buy a drive and motor from the same manufacturer to assure a combination that is well matched. Modern drives have improved considerably compared to those available some years ago.)
After using the PSAT, a new point below the first can be plotted in the specific energy diagram. (See Fig. 4, where this has been done.) Potential savings from using better-matched equipment at the upper duty point can be calculated from the difference in specific energy. PSAT does it automatically.
Pump control methodsIn many applications, pump flow is routinely controlled by throttling a control valve on the pump discharge. The throttled valve can be controlled to maintain a designated flow rate, pressure or any other parameter to satisfy system needs. When a valve is used to control flow, the flow rate is decreased by increasing resistance in the pipe system and moving the operating point up the pump head curve as shown in Fig. 3.
From the information in Fig. 3, it is possible to estimate the head necessary to produce a certain flow in the system if there were no throttling. (One way of getting the pump to operate at such an unthrottled duty point would be to use a variable speed drive to reduce pump output.) Head requirement without throttling can be read on the original unthrottled curve below the throttled operating point. Using PSAT, the best motor and pump efficiencies for this unthrottled operating point can be found and Es can be calculated and plotted in the specific energy diagram. The result is a good graphical representation of where the system is operated from a cost point of view and where it could operate if optimized and without throttling losses (see Fig. 4).
In the Fig. 4 example, the original specific energy is about 4.8 Wh/Gallon at 700 ft. The optimized pump/motor combination is about 2.8, and the specific energy with an optimized pump/motor combination without throttling losses is around 1.2 Wh/Gallon at 300 ft.
Avoiding throttling losses is of the utmost importance when it comes to economic pumping. In the case of varying flow rates, Es has to be calculated for different flow rates. The corresponding head is obtained from the pump curve. The total operational cost can be obtained if the flow distribution as a function of time is known.
Key performance indicatorsAs indicated above, it is very useful to track the performance of a pump system not only to see how efficiently it is operating relative to optimum, but also to be able to easily and quickly discover deviations from the norm. It is, therefore, suggested that power-divided-by-flow rate would be a very useful KPI if flow rate and power are monitored.
In many industries, motor current is monitored instead of power. The current is roughly proportional to power and can be used as a substitute for power. In both cases, the quotient will be a very good measure of the system efficiency and also sensitive to system changes.
In a recent assessment of a pump station, it was found that one of three parallel pumps was drawing about 100kW, but contributed almost nothing in flow. The pump was practically dead headed by the other two pumps since the wear rings were badly worn and the delivered head, therefore, was lower than for the other pumps. As the system was set up to monitor total flow and motor currents independently, the problem with the pump was hidden. If the current-divided-by-flow rate for the system as a whole had been monitored and tracked, the problem would have caught someone’s attention sooner.
Another very valuable performance indicator is the repair record of a pump. Pumps are generally quite reliable. If they are operated close to their best efficiency points (BEPs), they should last for a long time. If a specific pump deviates from the rest of the pumps in a facility, or shows a rising curve for the cost of maintenance, there is good reason to investigate it further. Remember, there is a very strong relationship between reliability and efficient operation. Thus, an inefficiently operated pump usually costs more all the way around–not only to run, but also to maintain.
ConclusionPump systems should be continuously monitored and tracked using key performance indicators (KPIs) to discover performance improvement possibilities.
Power divided by flow rate also can be a very useful KPI for the task. This method gives a number that is directly proportional to the cost of pumping and is sensitive to changes in the system. Furthermore, it can easily be demonstrated graphically, so that operators get a visual picture of how efficiently their system is operating.
Following a long, distinguished career with ITT, including many years as Director of Technology for the corporation’s FluidTechnology business (i.e., ITT Flygt, Goulds Pumps, etc.), Gunnar Hovstadius went on to build a highly successful consulting practice in the field of pump-system efficiency. When he wrote this article in 2006, he was spending much of his time consulting with the Industrial Efficiency Alliance, based in Portland, OR. These days, Dr. Hovstadius continues to travel for and work with industrial and governmental clients around the globe. Among other things, his busy workload currently includes serving as a Pump System Optimization Expert for the U.S. Department of Energy and UNIDO. Email: gunnarh@msn.com.


 8613371530291